See the attacks your firewall can't stop.
Leverage the intrusion detection work of 290+ security centers — without the cost of running your own SOC. Discover what's really hitting your network, risk-free.
A Current Firewall & IPS Cyber Efficiency Report
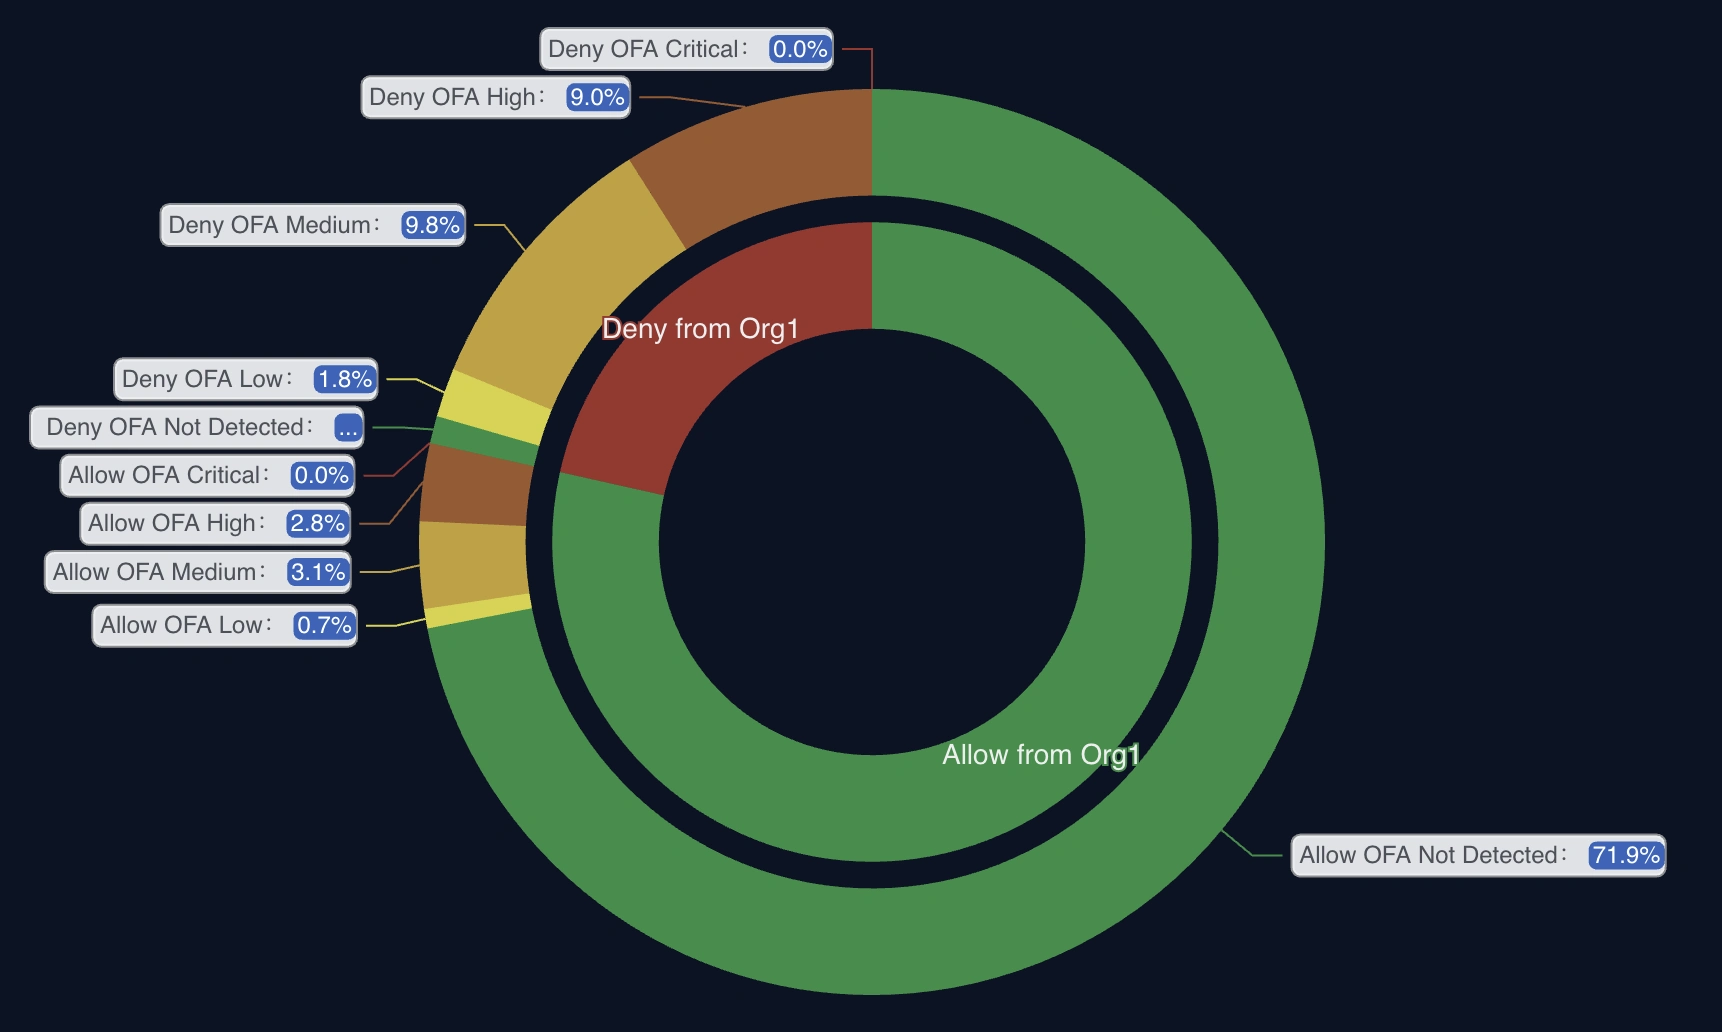
- A PDF summary with findings and your Crime Score
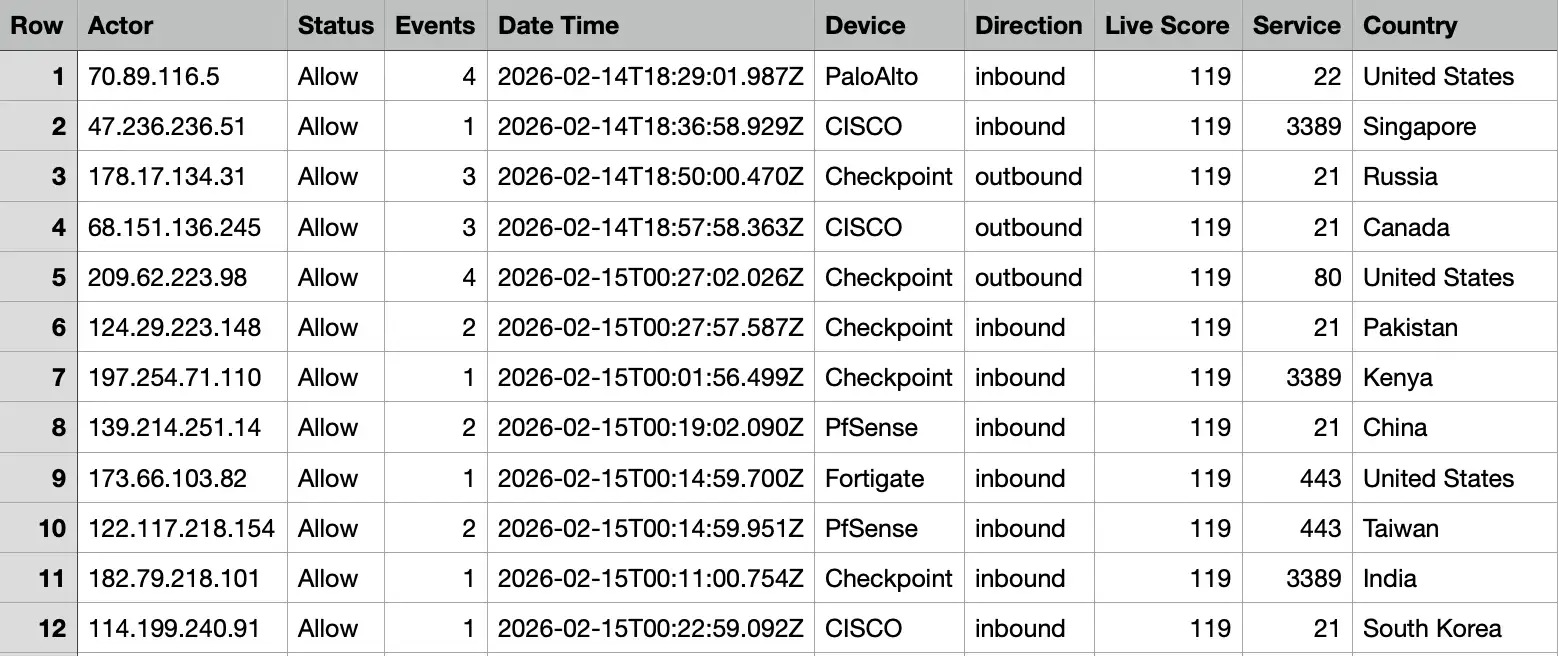
- A CSV file listing all detected attacks not currently blocked
- A cost-saving potential estimate for your environment
Once you submit the form, our team will contact you to schedule a session and kick off the Proof of Value on your infrastructure.
What the Proof of Value actually does
A Virtual Machine running the OneFirewall platform analyses your edge traffic logs to detect malicious activity — on-premises or in your private cloud, with nothing sent externally.
Real-Time Detection
Identifies malicious actors attempting to penetrate your perimeter before damage occurs.
Comprehensive Visibility
Analyses edge traffic to provide complete insight into potential security threats.
Actionable Intelligence
Delivers real-time alerts and detailed reports on detected threats, enabling rapid response.
Risk-Free Evaluation
Deploy in your environment to assess effectiveness without long-term commitment.
In real time, during the PoV
Malicious connection attempts, scanning activity, brute-force attacks, exploitation attempts, suspicious outbound connections, and repeat attacker infrastructure already classified across the alliance — the attacks you're exposed to that aren't being blocked today, and how collective intelligence changes the outcome.
What actually lands in your inbox
The CSV — every allowed attack, itemised
The PDF summary — allow/deny breakdown by severity
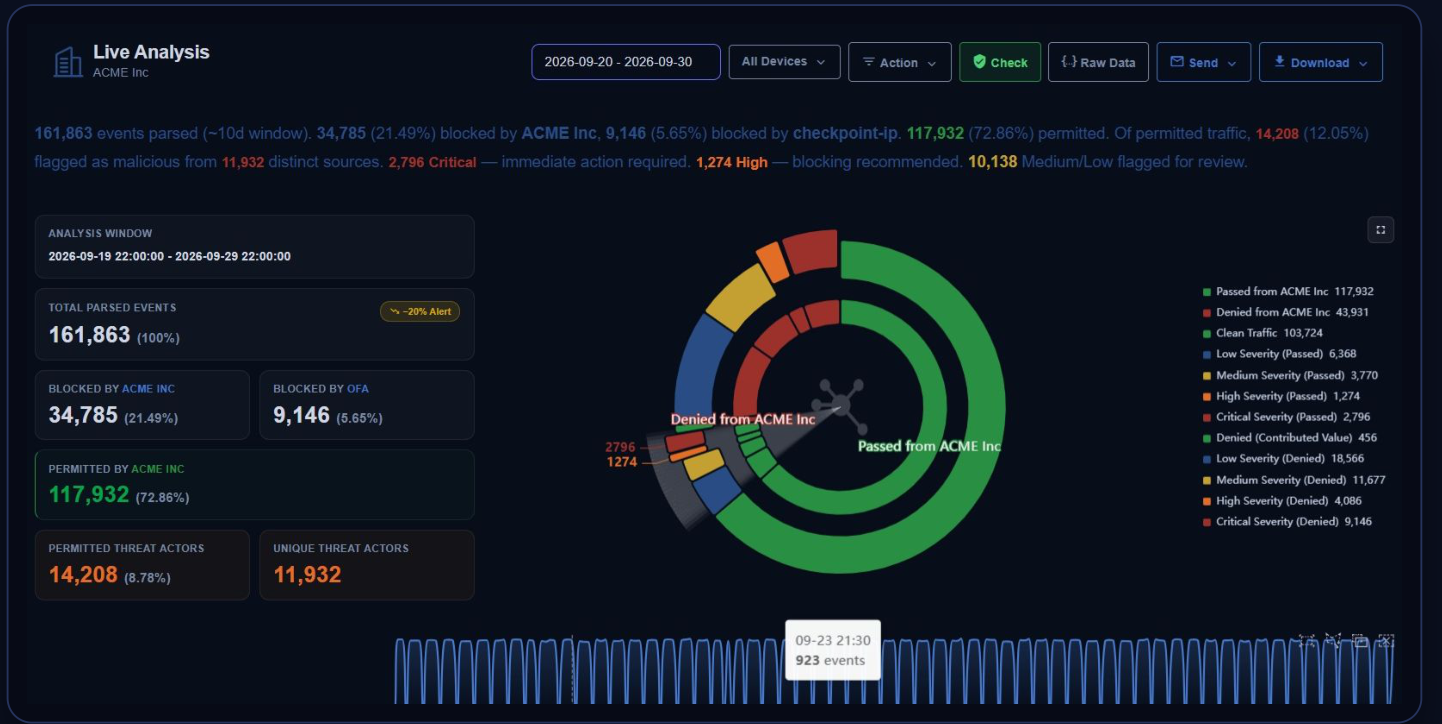
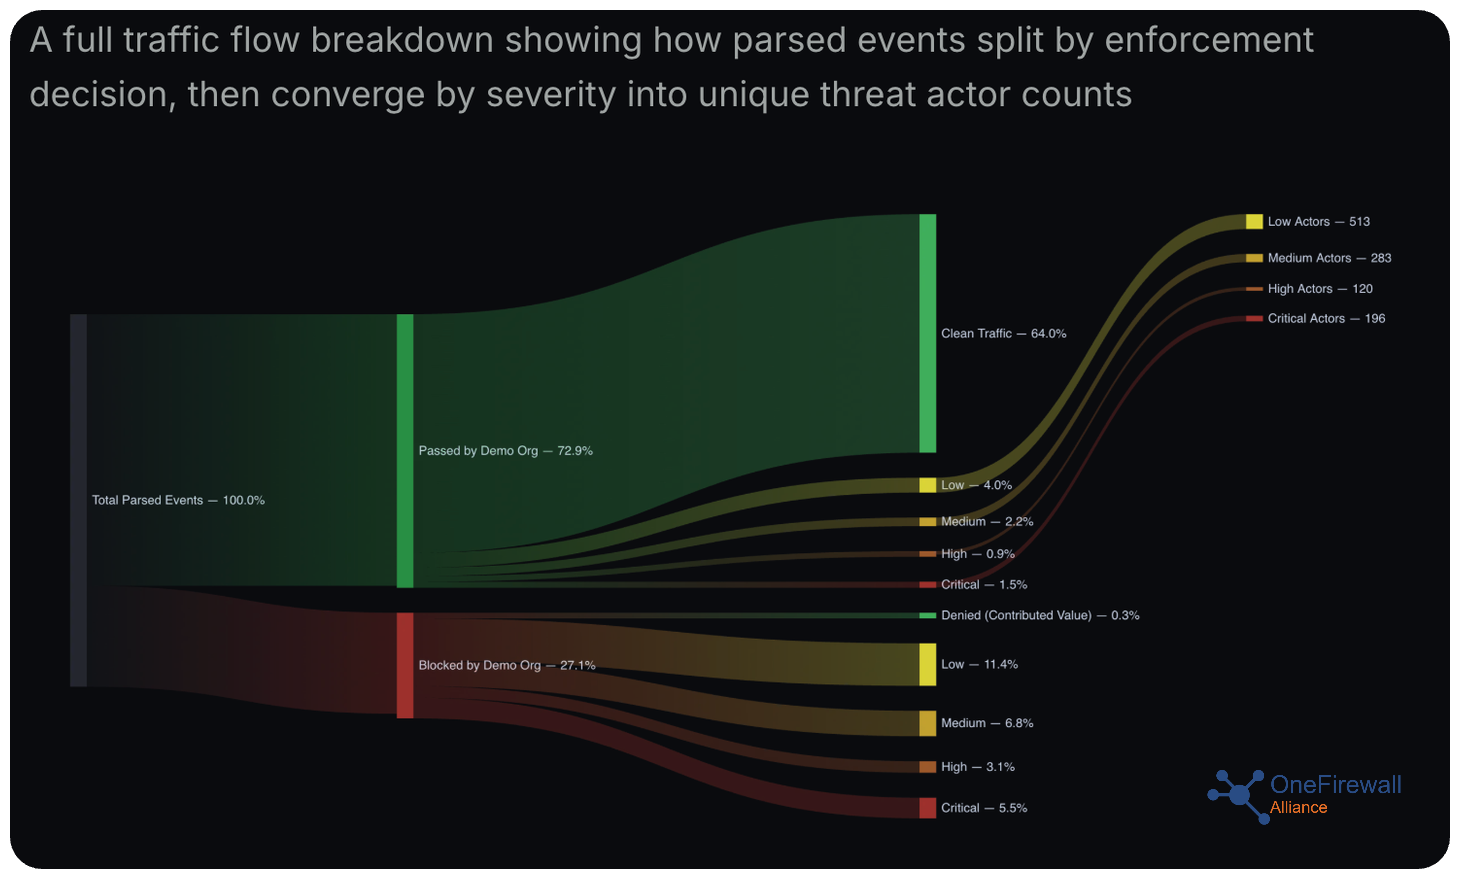
Live analysis of 10 days of customer traffic
161,863
Events analysed
72.86%
Traffic allowed by the customer's firewall
14,208
Malicious events in allowed traffic (12.05%)
2,796 · 1,274
Critical and High: immediate action and block recommended
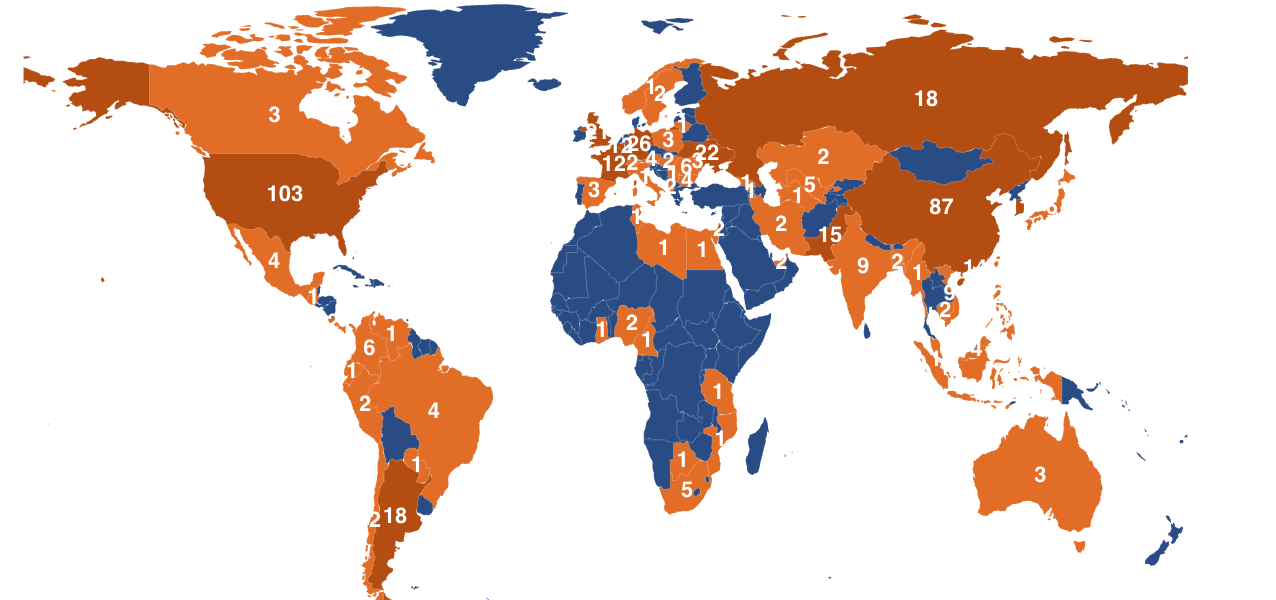
The same 10-day window, mapped by origin: attack traffic reaching this one customer's perimeter from over 70 countries — a reach no single organisation's own logs could show on their own.